
Figure 2.
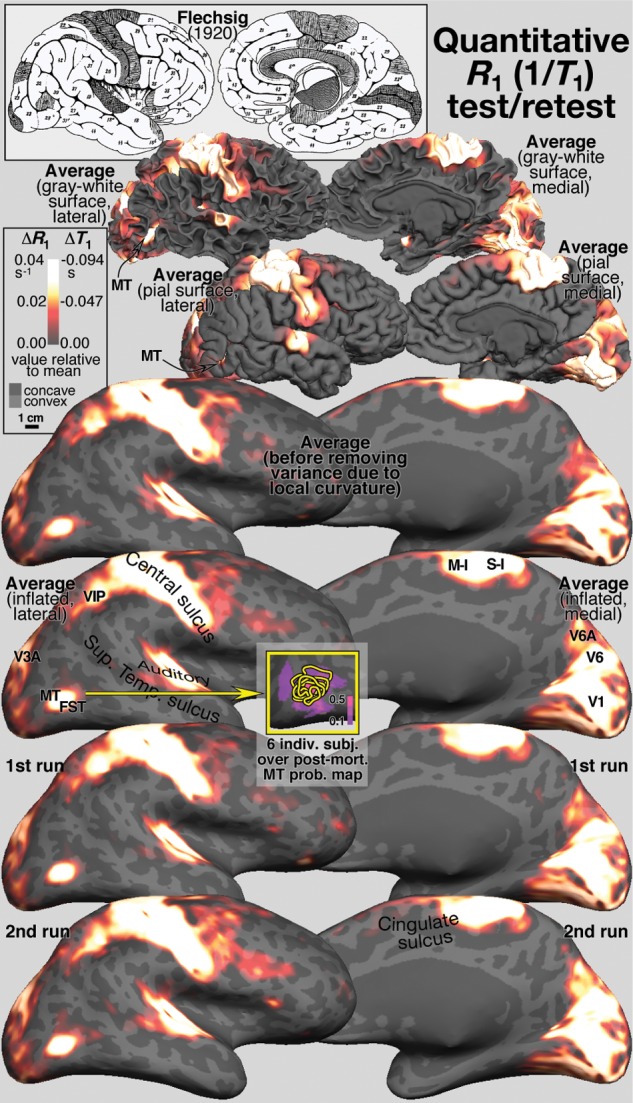
Cross-subject surface average relaxation rate (R1) test/retest. Top left inset redrawn from Flechsig (1920) shows early myelinating areas in gray. Rows 1–6 show spherical morph cross-subject average ΔR1 (difference above mean) projected back onto the gray–white, pial, and inflated surfaces of 1 subject. R1 values in each subject were sampled at a point halfway between the individual's gray–white matter and pial surfaces. Row 3 shows the data before removing variance due to local cortical curvature; that variance is removed in all other rows. Rows 5 and 6 show excellent scan/rescan reliability of average. Lower middle inset shows same magnification lateral occipital cutout with individual subjects' R1 maxima (yellow contours), superimposed on MT postmortem probability map in purple (Malikovic et al. 2007; Fischl et al. 2008), showing that the individual and average R1 maxima differ subtly from the postmortem map. See text for midline and anterior insula mask.