
Figure 4.
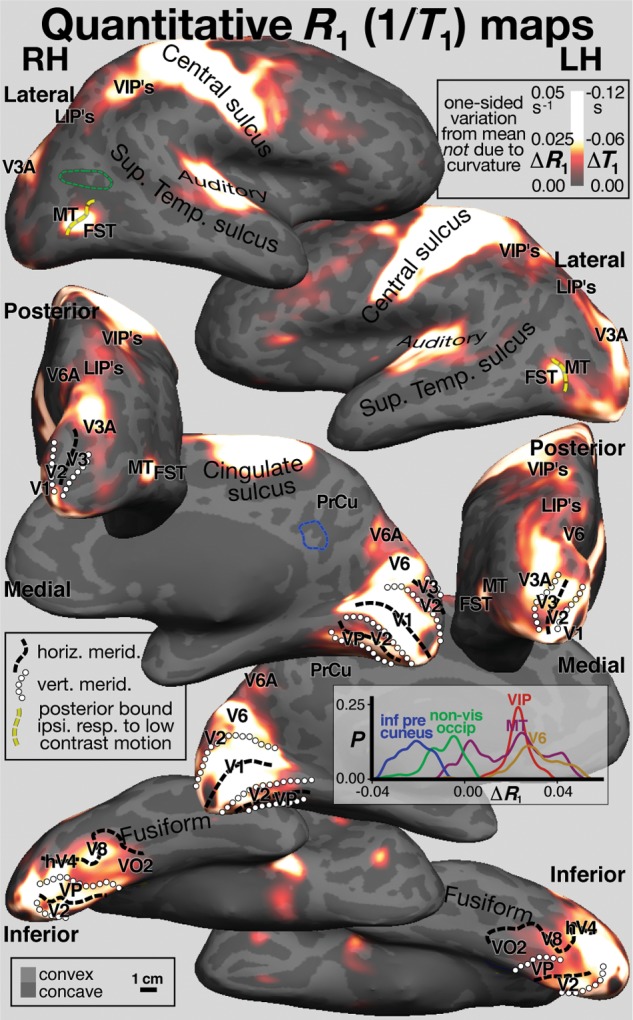
Cross-subject surface average quantitative R1 (=1/T1) maps. Spherical morph average maps of quantitative R1 values sampled at 50% of cortical thickness are projected back to the same subject as in Figure 3, and posed and annotated identically. Quantitative R1 is illustrated as variation from the mean (ΔR1) after removing variance due to local cortical curvature. A histogram of ΔR1 values from 3 right hemisphere visual areas (V6, MT, and VIP, defined by retinotopy) and 2 right hemisphere non-visual areas (inferior pre-cuneus “default mode” area and non-visual lateral occipital cortex) is shown in the lower middle inset. The non-visual regions of interest are shown as dashed lines in matching blue and green (upper left and middle left). The maxima shown are 3–4% higher than the average R1.