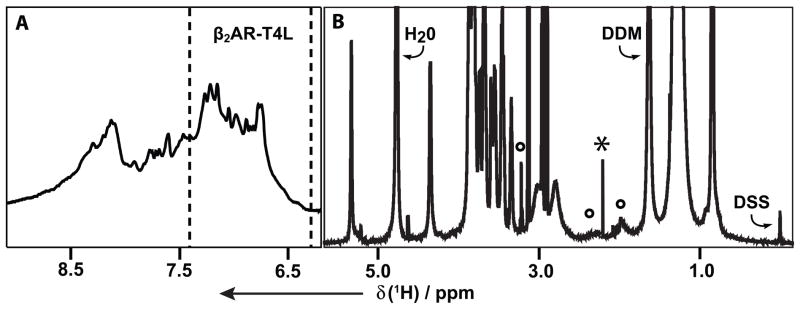
Figure 2.

1D 1H NMR spectrum at 700 MHz of a 0.5 mM aqueous solution of the β2AR-T4L–timolol complex reconstituted in DDM micelles, DDM concentration = 100 mM, pH = 7.5, T = 298 K. The spectral regions in panels (A) and (B) were recorded with different experimental parameters (see Experimental). (A) The signal intensity between the broken vertical lines was evaluated in determinations of the diffusion coefficient Dt,pm of the β2AR-T4L–timolol complex in DDM micelles. (B) The DDM signal used for measurements of apparent diffusion coefficients, , is identified. Well-resolved signals of β2AR-T4L-associated lipids from the membranes of the sf9 cells used for protein expression are marked with circles. A timolol signal at 2.15 ppm is identified with an asterisk, and the signal of the internal reference DSS is indicated.
