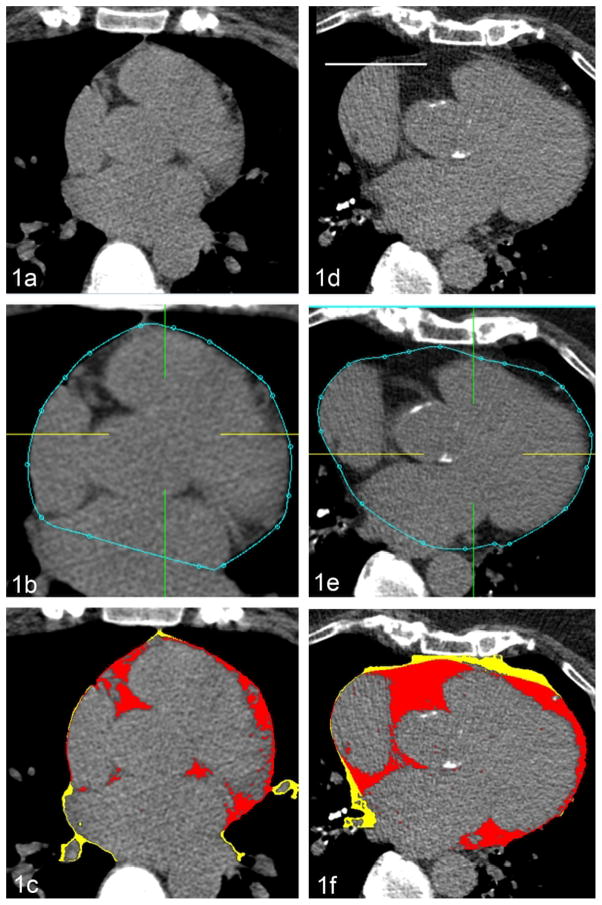
Figure 1.
The measurement of EFV in a patient with low (Figs. 1a–c) and high (Figs. 1d–f) EFV. The user identifies the pericardium and places approximately 10 contour points manually on the pericardium at each slice from the upper slice limit to the lower slice in the axial view. From these control points, the software (Q-FAT) automatically quantifies all fat voxels within the pericardial contour (blue line) and generates the EFV (red).
EFV – epicardial fat volume.

