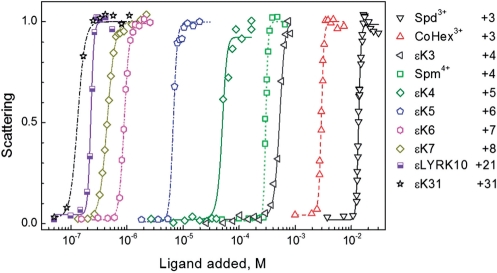
Figure 2.

Light scattering of plasmid DNA solution in dependence on concentration of some cationic ligands with net-positive charge ranging from +3 to +31 (100 mM KCl and 5 µM in DNA phosphate groups). Points are measured values (normalized relative to maximal intensity of light scattering observed in each titration); curves are sigmoid fitting of the experimental data. Net-positive charge of the ligands is indicated in the graph.
