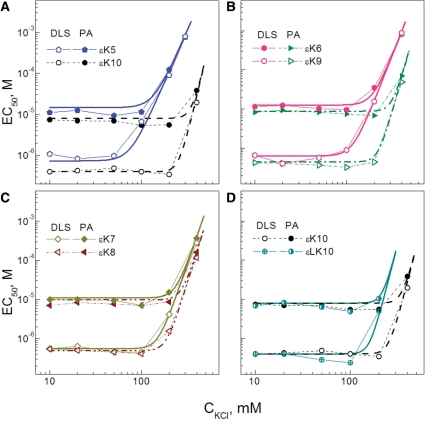
Figure 8.
Comparison of the experimental dependencies of EC50 on CKCl (data of DLS and PA shown as points with thin lines) to the calculated values using Equation (3) (displayed as smooth thick lines). (A–C) Results obtained for ε-oligolysine homologues from εK5 to εK10. Theoretical curves were drawn as follows: (A) fixed value Ncrit = 0.88 and the best fit values SK = 0.85Z and Kd(1 M) = 0.33 (eK5), 0.22 M (eK10) are used. Theoretical curves in (B) and (C) were built without fitting using the values SK = 0.85Z and Kd(1M) = 0.22 M; (B). Data for εK6 and εK9; (C) data for εK7 and εK8. (D) Comparison of the results calculated with Equation (3) with experimental results of the DLS and PA methods of εK10 and εLK10. Best fit is for Kd(1M) = 18 M and SK = 0.85Z with the fixed value Ncrit = 0.88; the data for εK10 are the same as in (A). See text for details.

