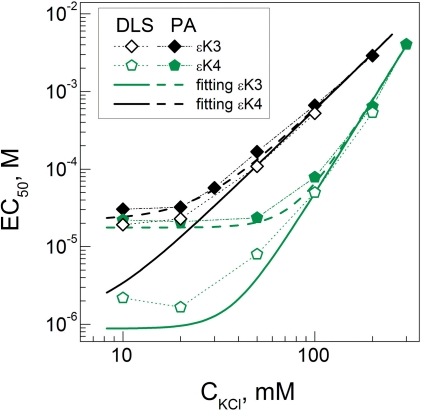
Figure 9.
Comparison of the experimental dependencies (points with thin lines) with prediction based on Equation (3) (shown as smooth thick lines) for data on DNA condensation by the ε-oligolysines εK3 and εK4. DLS and PA data are shown respectively as hollow and solid points. The parameters of Equation (3) are the same as in Figure 8A. See text and Supplementary Figure 4S and Table 4S) for more detail.

