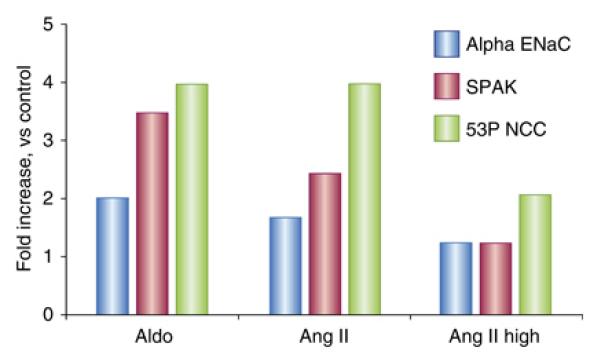
Figure 2.

Redrawn from data in the paper by van der Lubbe. Bar plot shows the effects of aldosterone (Aldo), angiotensin II (Ang II) and pressor dose Ang II (Ang II High) on abundance of the alpha subunit of ENaC, SPAK, and phosphorylated NCC. Note that all three interventions increase phosphorylated NCC, whereas only aldosterone increases ENaC abundance. Please see text for more details.
