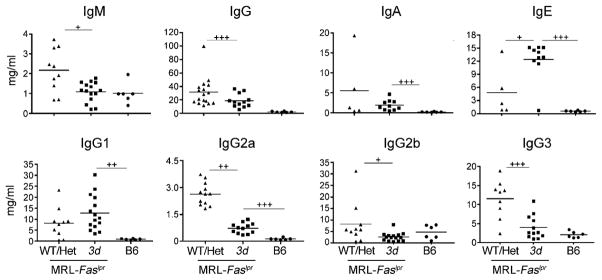
FIGURE 3.

Total isotype and subclass Ig concentrations in 3d MRL-Faslpr mice. Ig isotype and IgG subclass levels in WT/Het and 3d MRL-Faslpr mice and B6 controls at 6 mo (6–17 mice/group). One of three independent experiments is shown. +p < 0.05, ++ p < 0.01, +++p < 0.001; p < 0.05 for WT/Het versus B6 for all Ig isotypes and IgG subclasses except IgG2b.
