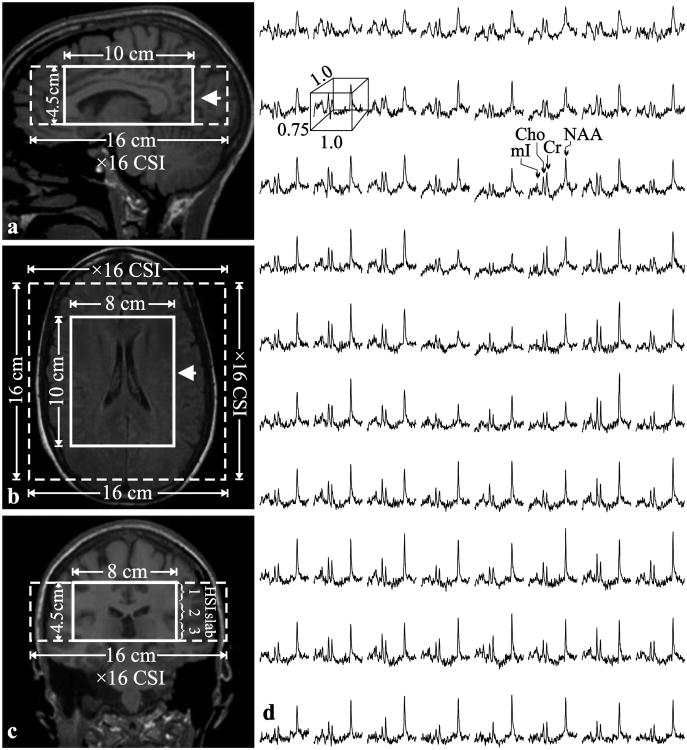
Fig. 1. Positioning of the 1H-MRS VOI.
Left: Sagittal (a) and coronal (b) T1-weighted and axial T2-weighted FLAIR MRI (c) of patient#18, superimposed with the 8×10×4.5 cm3 VOI (LR×AP×IS - thick solid white line) and 16×16×4.5 cm3 FOV (dashed white line). The arrow on each image indicates the spatial position of the image below. Right: (d) Real part of the 8×10 (LR×AP) 1H spectra matrix from the VOI on the axial image. All spectra are on common frequency (1.3 to 3.9 ppm) and intensity scales. Note the SNR and spectral resolution obtained from these 1.0×1.0×0.75 cm3 (LR×AP×IS) voxels in ∼30 minutes of acquisition.

