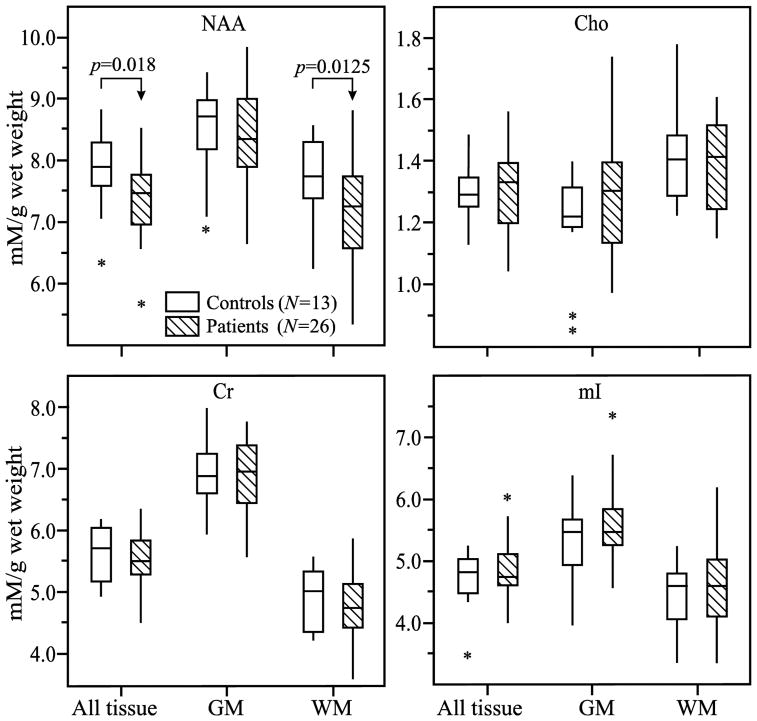
Fig. 4. Metabolic concentrations in GM and WM.
Box plots displaying 25%, median and 75% (box), 95% (whiskers) and outliers (*) of the NAA, Cr, Cho and mI concentrations distributions in the VOI (all tissue) and its GM and WM compartments mTBI patients and controls. Note that the significant decrease (arrows) of NAA in the VOI that is entirely attributable to the WM pathology.

