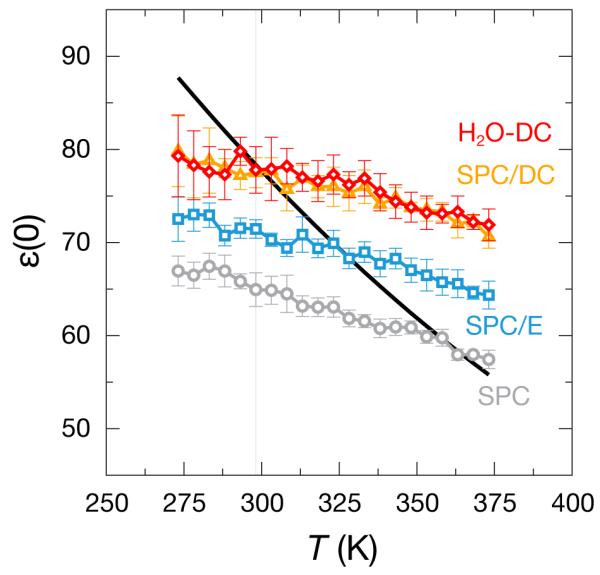
Figure 10.

The ε(0) as a function of temperature for the labeled water models alongside experiment22 (black line). All models capture the trend of decreasing ε(0) with increasing temperature, though they all fail to reproduce the experimental slope of this trend.
