
Figure 6.
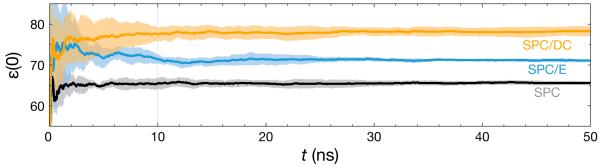
The static dielectric constant for SPC (black line), SPC/E (blue line), and SPC/DC (gold line) over the course of 50 ns of molecular dynamics at 298.15 K and 1 atm. The lines are averages of five simulations, and the shaded regions show the standard deviation of these averages. The plots show that the models have difficulty converging ε(0) on time-scales less than 10 ns, the length of simulations in our dielectric correction procedure. Longer simulations would likely aid in optimization processes set to converge on a high ε(0).