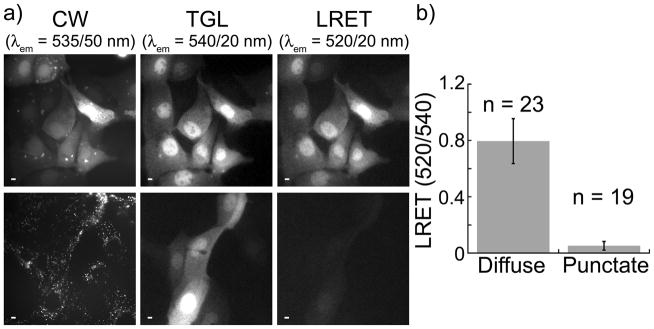
Figure 3.

Intacellular disulfide reduction releases cargo from carrier peptide. MDCKII cells were incubated for 10 min. at 37 °C in DMEM (−) containing 17 (10 μM), washed 2X in PBS and reimmersed in DMEM (+) containing 1 mM Patent Blue™ prior to imaging. Micrographs: CW, continuous wave fluorescence (λex = 480 ± 40 nm, λem = 535 ± 50 nm); TGL, time-gated luminescence (delay = 10 μs, λex = 365 nm, λem = 540 ± 10 nm); LRET, luminescence resonance energy transfer (delay = 10 μs, λex = 365 nm, λem = 520 ± 10 nm). Scale bars, 10 μm. a) (top) Representative images of cells acquired immediately following wash step. Fluorescein fluorescence, Tb3+ luminescence, and Tb3+-to-fluorescein LRET signals are diffuse throughout cytoplasm and nucleus. (bottom), Representative images of cells acquired ~2 h post-wash. Fluorescein signal is punctate while Tb3+ luminescence and diminished LRET signals remain diffuse. b) Mean, normalized, time-gated LRET signal (520 nm/540 nm) measured in the nuclear region of cells exhibiting diffuse (immediate) and punctate (2 h post-wash) patterns of continuous wave, fluorescein fluorescence. Error bars represent standard deviation of the mean values (n = no. of cells) obtained from 4 separate experiments.
