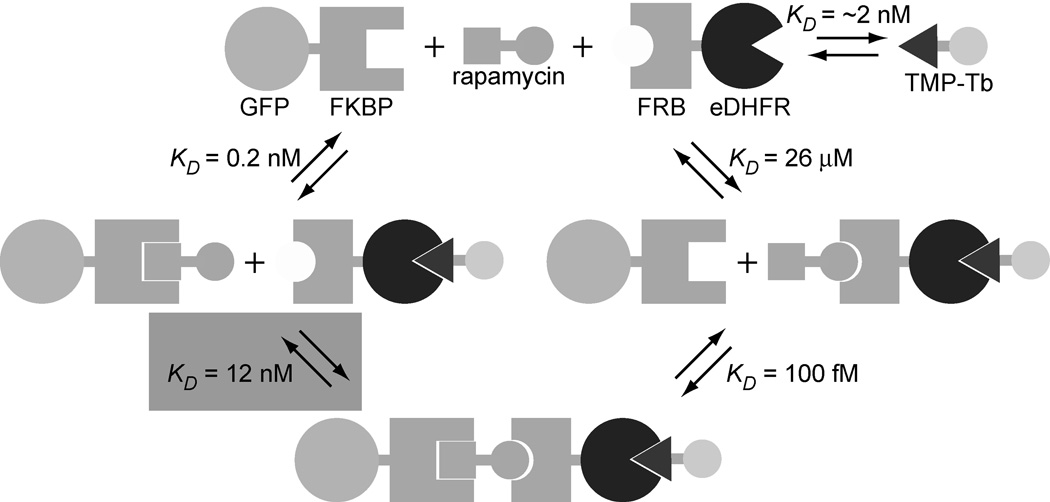
Figure 2.
Schematic diagram representing the binding events involved in the formation of a GFP-FKBP/rapamycin/FRB-eDHFR/TMP-Tb complex. The relative magnitudes of the dissociation constants (ref. 21) are such that it is the interaction between GFP-FKBP/rapamycin and FRB-eDHFR (KD = 12 nM, shaded) that is measured in a saturation binding assay. By maintaining a constant ratio of FRB-eDHFR relative to TMP-Tb, it is possible to titrate either GFP-FKBP or FRB-eDHFR, and the measured Tb3+-to-GFP LRET signal reflects formation of the FKBP/rapamycin/FRB complex.

