Figure 3.
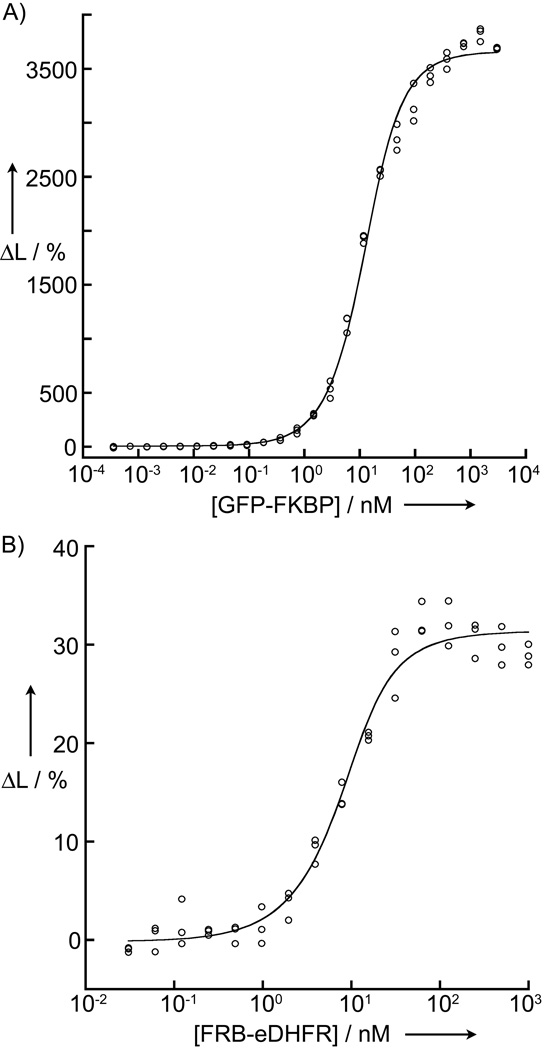
Homogeneous, time-resolved LRET assay detects and measures PPI affinity and inhibition at high signal-to-background ratio. Plots show the outcome of saturation binding experiments in 96-well plates (100 µL sample volume). The y-axes represent the percent change in the 520 nm/615 nm emission ratio and the x-axes represent concentrations of the titrated analytes. Complete details of sample preparation and data analysis are given in the text and Supporting Information. (a) Data showing equilibrium binding (120 min. after sample preparation) of purified GFP-FKBP/rapamycin complex (3 uM to 0.4 pM) to purified FRB-eDHFR (10 nM). Line represents non-linear least squares (NLS) fit to equation 2, yielding KD = 7.5 ± 0.4 nM. (b) Data from titration of purified FRB-eDHFR (1 uM to 30 pM) against purified GFP-FKBP/rapamycin complex (10 nM) obtained 45 min. after sample preparation. NLS fit to equation 2 yielded KD = 3.3 ± 0.6 nM.

