
Fig. 3.
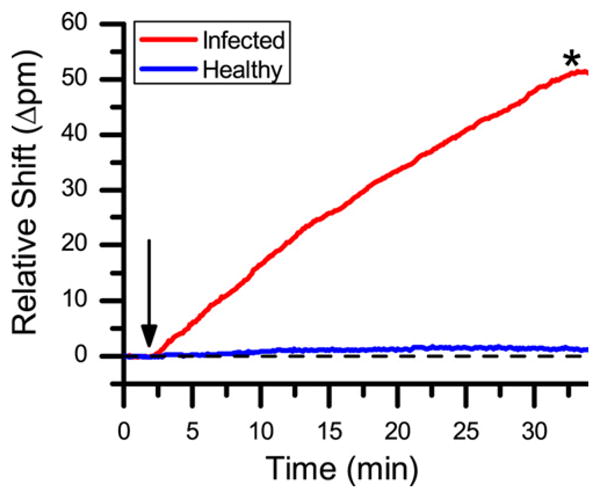
Sensor response to diluted extracts from soybean leaves. The red trace represents a 1:200 dilution of the leaf extract from a BPMV infected sample, the blue trace represents a 1:200 dilution of the leaf extract from a healthy sample.
Official websites use .gov
A
.gov website belongs to an official
government organization in the United States.
Secure .gov websites use HTTPS
A lock (
) or https:// means you've safely
connected to the .gov website. Share sensitive
information only on official, secure websites.
Sensor response to diluted extracts from soybean leaves. The red trace represents a 1:200 dilution of the leaf extract from a BPMV infected sample, the blue trace represents a 1:200 dilution of the leaf extract from a healthy sample.