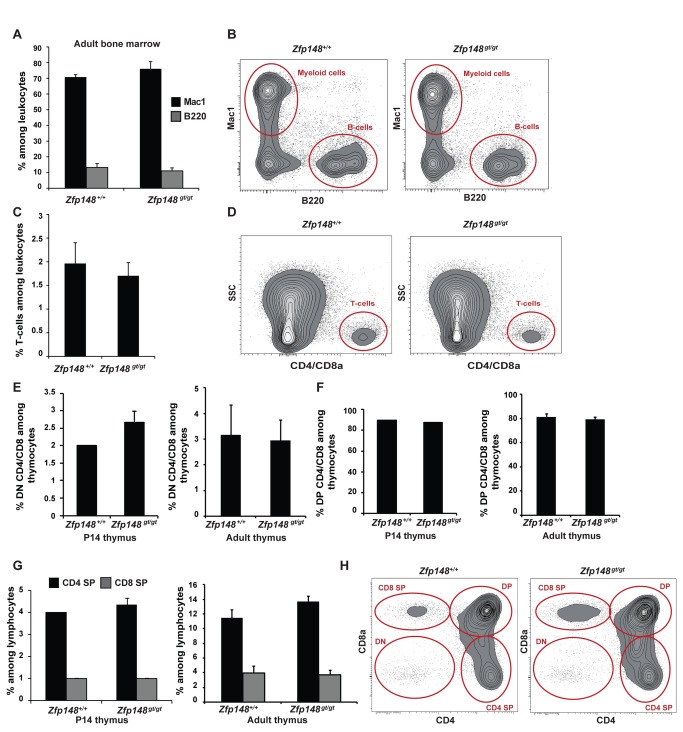
Figure 2. Differentiation of hematopoietic lineages in thymus and bone marrow of Zfp148-deficient mice.
Flow cytometric analysis of bone marrow (A–D) and thymocytes (E–H) from wild type and Zfp148 gt/gt mice. Graphs and representative cytograms show percentage of (A, B) Mac1-, B220- and (C, D) CD4 and/or CD8-positive cells among leukocytes in bone marrow from adult mice, ages 3-6 months; wild type (n = 6) and Zfp148 gt/gt (n = 5). (E–H) Percentage of (E) double negative (DN) CD4/CD8, (F) double positive (DP) CD4/CD8, (G) CD4 single positive (SP) and CD8 SP cells among thymocytes from P14 pups (left, n = 3) and adult mice (right, n = 5). (H) Representative cytograms from adult thymus. Values are expressed as mean ± SEM. Significance levels: *P<0.05, **P<0.01.

