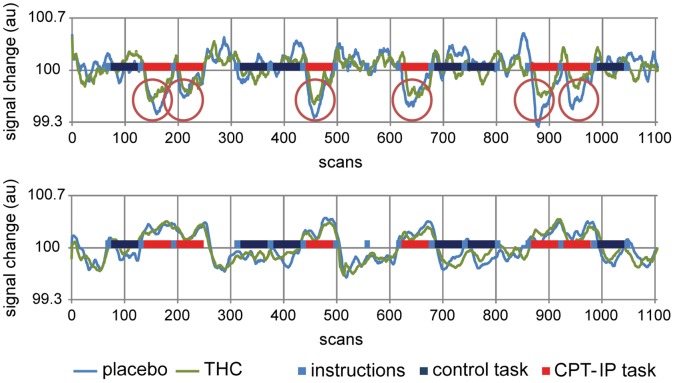
Figure 5. Activity over time in the TID (upper graph) and TIA network (lower graph) during CPT-IP performance.
The figure shows activity after placebo (blue) and THC (green) administration (n = 20; mean). The upper graph demonstrates the consistently smaller deactivation in the TID network after THC administration, while the lower graph shows that activity in TIA ROIs is virtually unchanged after THC. TIA, task-induced activation; TID, task-induced deactivation; au, arbitrary units.

