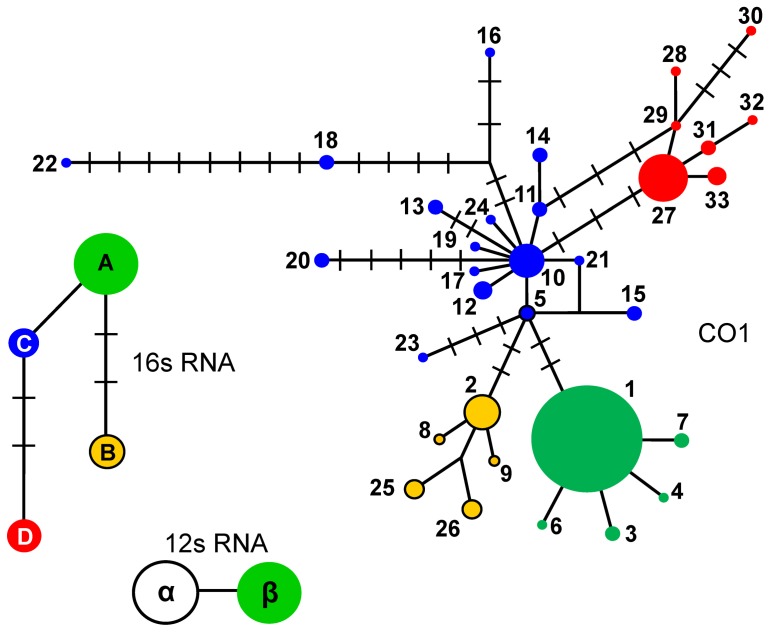
Figure 2. Median-joining networks depicting the relationships among genealogical lineages of A. obtectus.
In each network, circles represent either COI haplotypes (coded with numbers), 16s rRNA haplotypes (coded with letters), or 12s RNA haplotypes (coded with Greek letters); circle size is proportional to the relative frequencies. Numbers of substitutions are indicated with bars when there is more than one. Major mitochondrial lineages have been color-coded for reference purposes.

