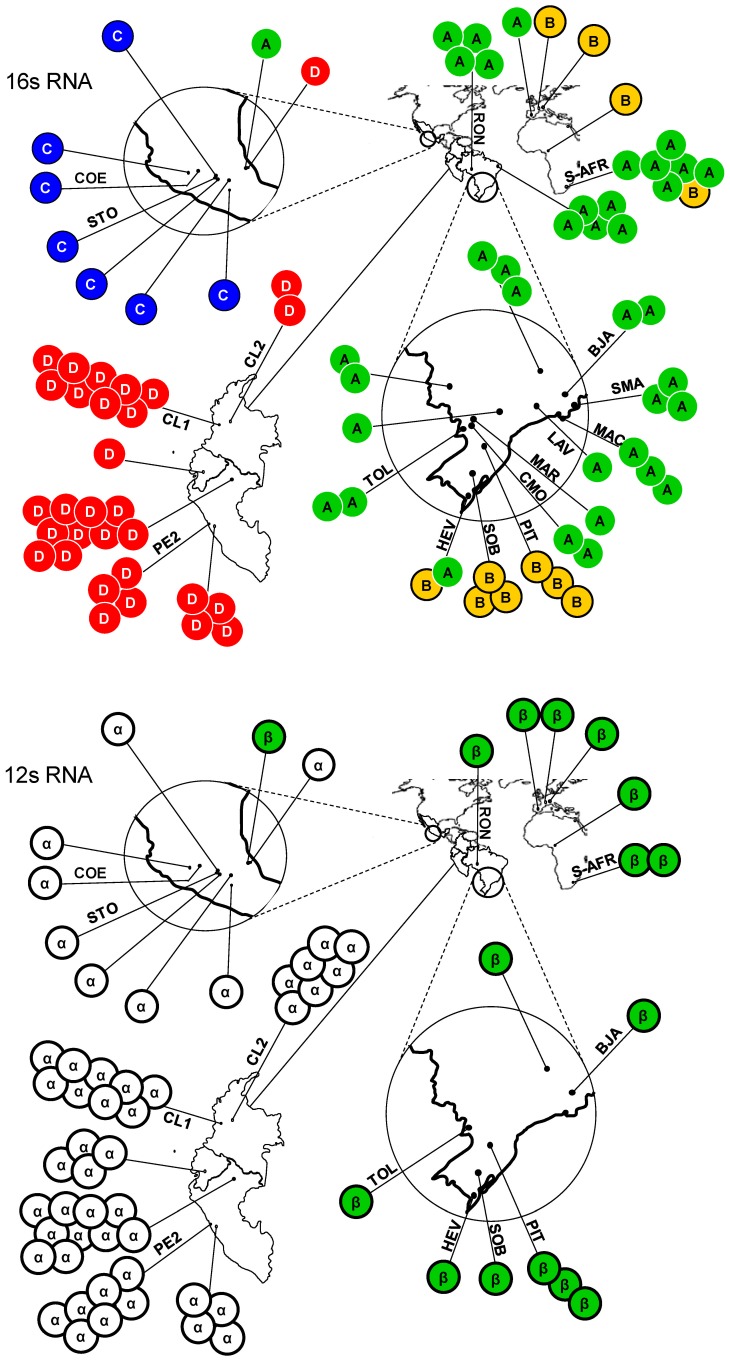
Figure 3. Geographic distributions of the 16s rRNA and 12s rRNA haplotypes of A. obtectus.
Distributions of the four 16s RNA haplotypes are shown at the top, whereas the distributions of the two 12s RNA haplotypes are shown at the bottom. Each circle represents the haplotypes found in a given population; a letter within a circle denotes the rRNA haplotypes found in that population. Codes are as given in Table S1 in File S1; for the remaining populations, see Alvarez et al. 2004 and 2005. Major mitochondrial lineages have been color-coded for reference purposes.

