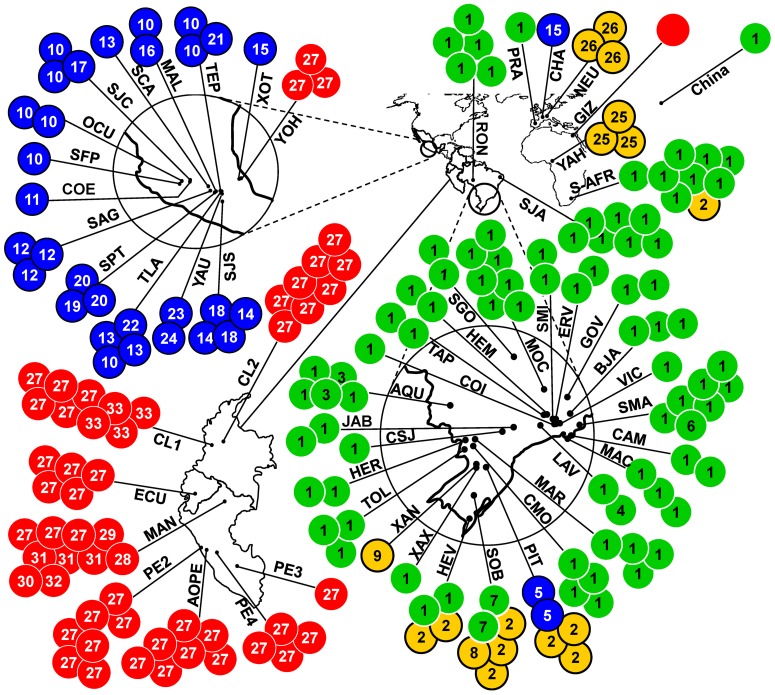
Figure 4. Geographic distributions of the 35 COI haplotypes of A. obtectus.
Each circle represents the haplotypes found in a given population; a number within a circle denotes the COI haplotypes found in that population. Codes are as given in Table S1 in File S1; China, GenBank Accession FJ465153; for the remaining populations, see Alvarez et al. 2004 and 2005. Major mitochondrial lineages have been color-coded for reference purposes.

