
Figure 5.
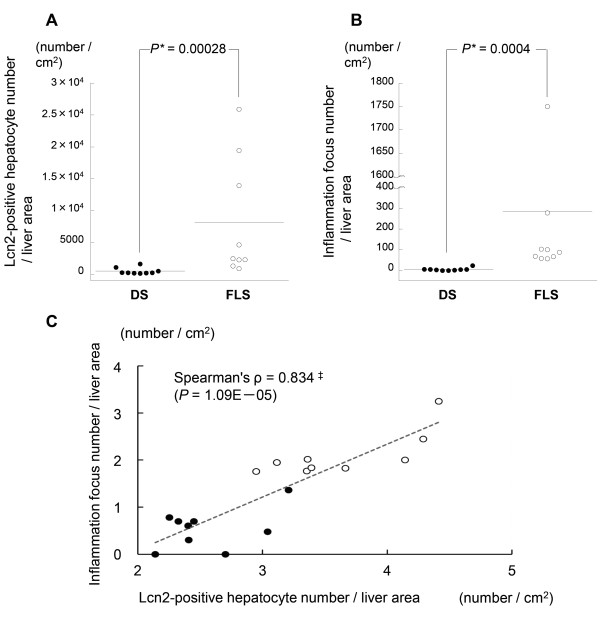
Quantification of LCN2 and inflammation in hepatic specimens from 19-week-old mice. (A) LCN2 protein expression: number of positive hepatocytes per cm2; (B) Number of inflammatory foci per cm2; (C) Correlation between LCN2 protein-expressing hepatocytes (log scale) and number of inflammatory foci (log scale) (n = 19). *Mann–Whitney U-test. ‡Spearman rank correlation coefficient; solid circles, DS; open circles, FLS.