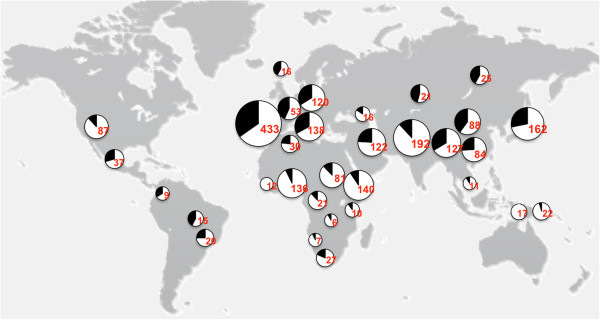
Figure 2.

World-wide distribution of the BTNL8_BTNL3-del allele in different human populations. Genotype analysis of populations is shown over a map of the world. The deletion frequency is indicated by the black part of the pie in the chart. Total number of individuals genotyped is given in red.
