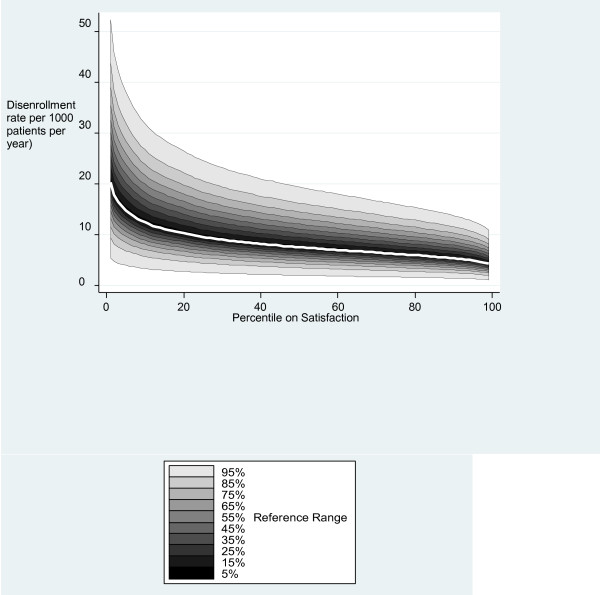
Figure 2.
Variation in adjusted rates of disenrollment for different levels of patient satisfaction. This figure shows the mean (white line) and the typical ranges of adjusted disenrollment rates (shaded areas) for practices at different levels of patient satisfaction scores. The different levels of shading indicate the fraction of practices which lie within that range. An adjusted disenrollment rate of 10 per 1000 patients per year is within the expected reasonable range for any levels of satisfaction. Disenrollment rates have been adjusted for GP Patient survey items, doctor and practice characteristics.

