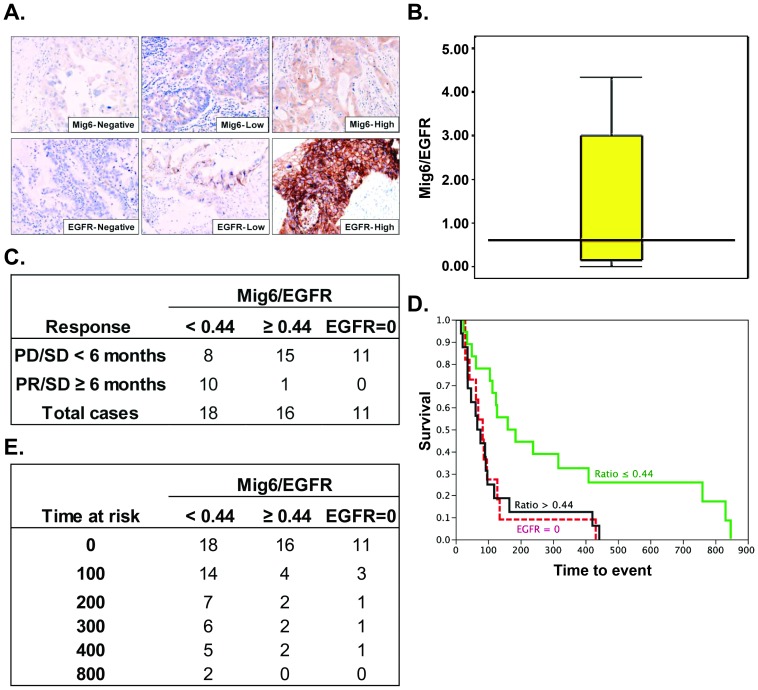
Figure 6. Mig6/EGFR ratio correlates with the response of patients to gefitinib.
A) Selected pictures of IHC staining against Mig6 and EGFR. B) Box plot of Mig6/EGFR ratio distribution. C) The response of patients to gefitinib treatment. PD, progressive disease; SD, stable disease; PR, partial response. D) Kaplan-Meier survival curves showed that patients with low Mig6/EGFR ratio survived significantly longer than the high ratio patients and EGFR negative patients (Log-Rank test P = 0.0112). E) The number of patients as risk at the time point of 0, 100, 200, 400 and 800 days was displayed in the table.

