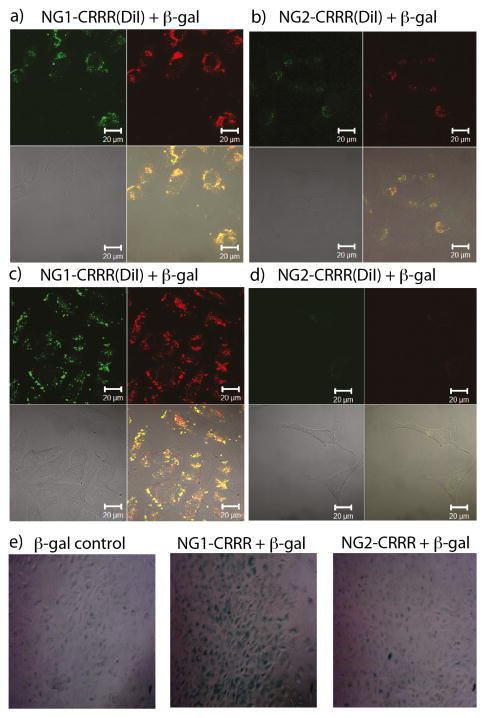
Figure 3.
Protein and hydrophobic dye delivery using NG1-CRRR (a and c) and NG2-CRRR (b and d) without serum, and with serum, respectively. Within each image set, top left is the FITC channel which shows green color (β-gal) and top right is the DiI channel which shows red color (hydrophobic dye). Bottom left is the DIC image and bottom right is an overlap of all three. Yellow color is overlay of green and red. Scale bar is 20 μm. (e) X-gal activity assay of delivered β-gal into cells.

