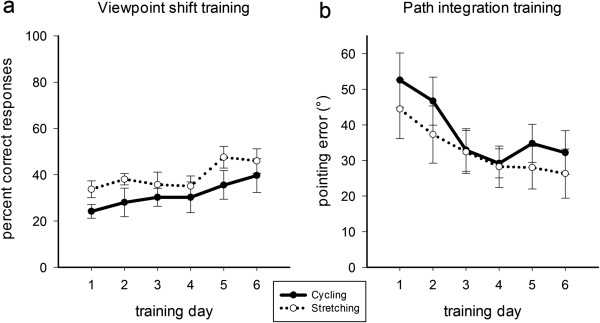
Figure 3.

Learning curves for the viewpoint shift training (a) and the path integration training (b) across training days separately for the cycling group (solid line) and the stretching group (dashed line). Chance level in the viewpoint shift task was 1.3%. Error bars depict +/− 1 standard error.
