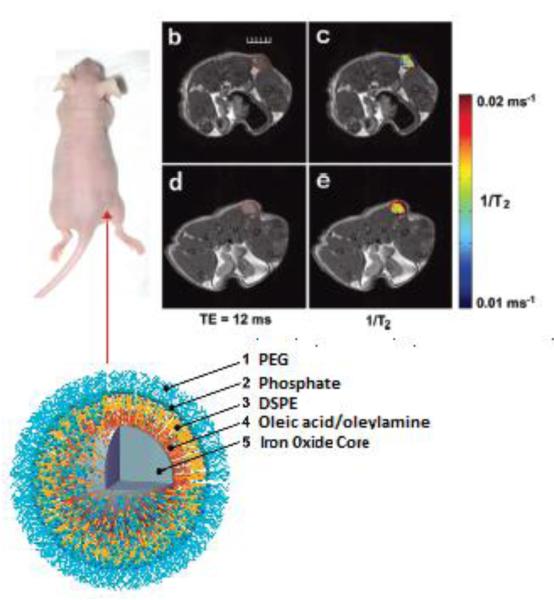
Figure 4.
Red arrow shows the location of the subcutaneous tumor. (b &c) MR images of the tumor before probe injection. (d &e) MR images collected after 1 hr following the injection of 14 nm SPIOs conjugated with antibodies against mouse VEGFR-1. The red dotted line in (b) and (d) outline the tumor (Scale bar represents 5 mm) [45].

