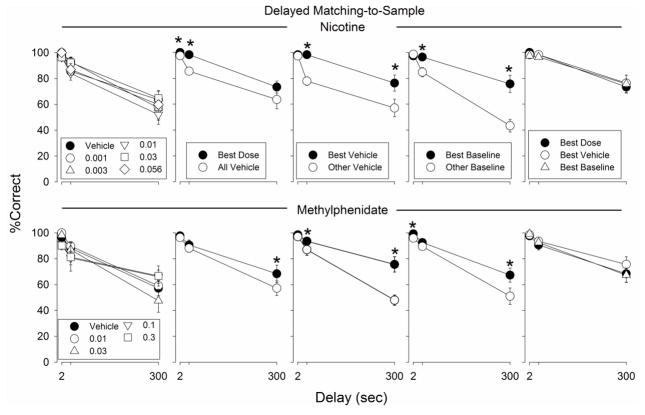
Fig. 1.
Percentage correct trials in the DMTS procedure on trials with 2-, 30-, and 300-s delays. The graphs in the top row depict percentage of correct trials in sessions that occurred during determination of a range of doses of nicotine (0.001 – 0.056 mg/kg): nicotine administration sessions and vehicle sessions (leftmost graph), individually-determined best dose sessions and vehicle sessions (second graph from left); best vehicle session and other vehicle sessions (third graph from the left); best baseline session and other baseline sessions (fourth graph from the left); and best dose, best vehicle, and best baseline sessions (last graph from the left). The graphs in the bottom row depict percentage correct trials in sessions that occurred during determination of a range of doses of methylphenidate (0.01 – 0.3 mg/kg). Each data point represents the average of 7 or 8 monkeys. Error bars represent ± SEM. * indicates a statistically significant difference from other data points at same parameter value

