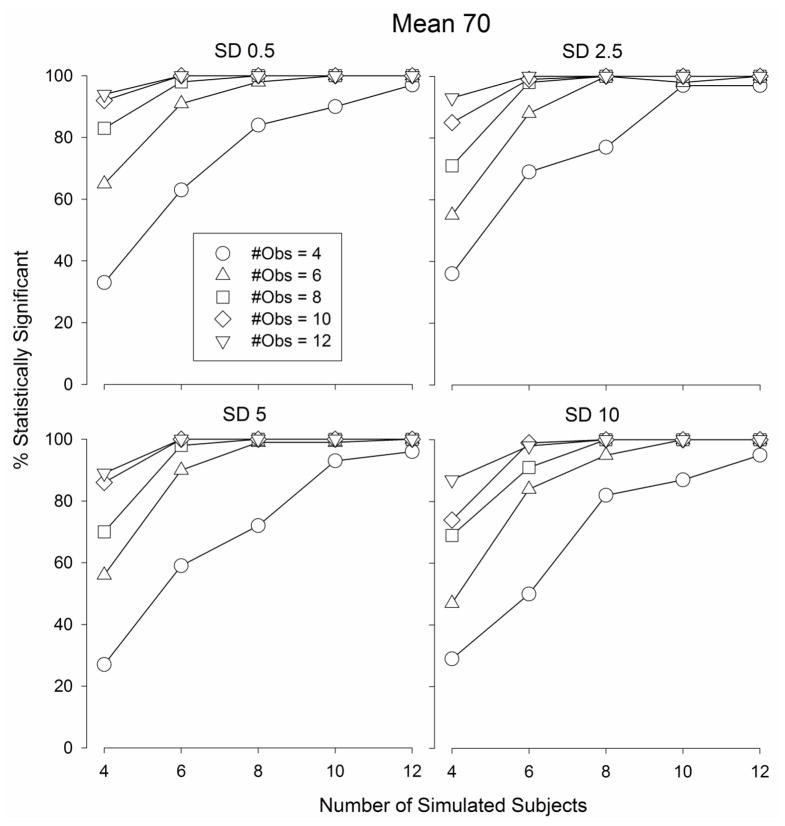
Fig. 6.
The percentage of statistically significant outcomes obtained from Monte Carlo simulations in which a best dose analysis was applied to sets of randomly generated data selected from a normal distribution with a mean of 70 and a standard deviation of 0.5 (top left graph), 2.5 (top right graph), 5 (bottom left graph), and 10 (bottom right graph)

