Figure 3.
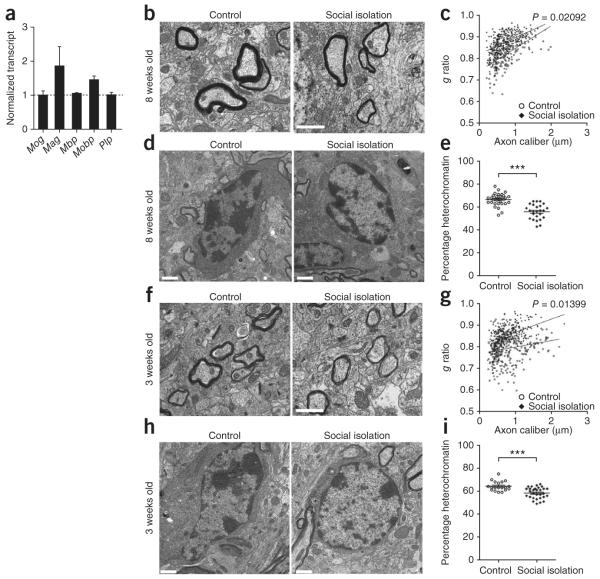
Short-term isolation is sufficient to induce chromatin changes and reduce myelin thickness in both adult and juvenile mice. (a) qRT-PCR of myelin transcripts in the PFC of adult (8 week old) mice after 2 weeks of social isolation. Bar graphs indicate average values for isolated mice after Gapdh normalization and are presented as relative values to average control levels (dashed line). (b,f) Electron micrographs of axons in PFC of adult (b) and juvenile (f) mice after 2 weeks of social isolation. Scale bars, 1 μm. (c) Scatter plot of g ratio values in adult PFC of isolated (n = 279 axons) and control (n = 200 axons) mice. (d,h) Electron micrographs of oligodendrocyte nuclei in PFC of adult (d) and juvenile (h) mice in control housing or isolated for 2 weeks. Scale bars, 1 μm. (e,i) Scatter plot of the percentage of nuclear heterochromatin in PFC oligodendrocytes in adult (e) isolated (n = 40 nuclei) and control (n = 36 nuclei) mice and juvenile (i) isolated (n = 30 nuclei) and control (n = 19 nuclei) mice. (g) Scatter plot of g ratio values in juvenile PFC of isolated (n = 248 axons) and control (n = 333 axons) mice. ***P < 0.001. Error bars, s.e.m.

