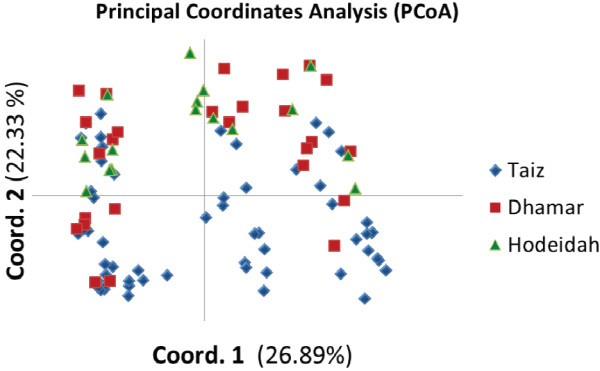
Figure 2.

Graphical plotting of the PCoA based on genetic variation of non drug-resistant genes (Pfg377, MSP-2 and three microsatellites in chr 8) among Plasmodium falciparum parasites in three sites in Yemen, and variation representation by each axis. Blue icon = Taiz, red icon = Dhamar and green icon = Hodeidah.
