
Figure 3.
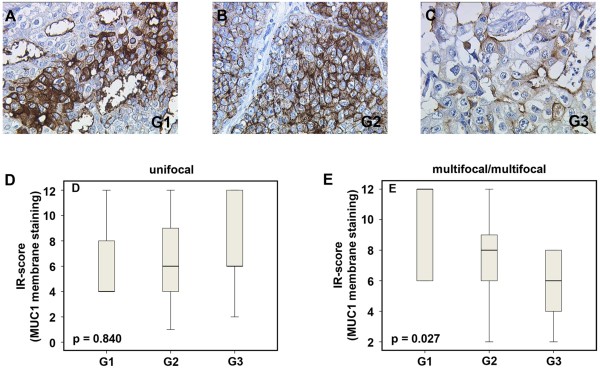
MUC1 (mPankoMab) membrane expression in the total collective of multicentric/multifocal breast cancer in a G1 tumor (A), a G2 tumor (B), and a G3 tumor (C); magnification 25× lens. The box plots (D, E) present a semiquantitative evaluation of staining results (IR score). The boxes represent the range between the 25th and 75th percentiles with a horizontal line at the median. The bars delineate the 5th and 95th percentiles.