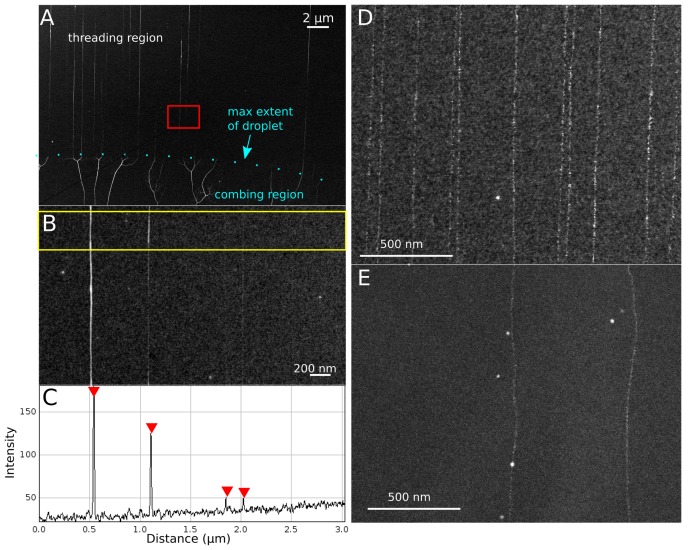
Figure 4. SEM characterization of threaded DNA.
All images were taken on a Hitachi S-5500 high-resolution transmission SEM (∼1 nm resolution), operated at 30 kV, with 50 µA maximum post-flash current. (A) Synthetic ssDNA modified with EM-dense labels to enhance contrast against 5 nm thick semiconductor support films. The deposition pattern indicates the behavior of DNA under the action of a receding meniscus compared to the molecular threading process. (B) High resolution image of a section of four deposited threads ((A) – red box). (C) Intensity profile for a cross section of ((B) - yellow box). The non-homogeneous contrast between threads is likely explained by variability in the number of ssDNA molecules making up each thread, while non-homogeneous contrast between different regions of the same thread is likely explained by secondary structure. (D & E) Comparison between (D) molecular threading and (E) molecular combing of synthetic ssDNA, modified with a thymidine-specific label osmium 2-2′-bipyridine (osbipy), onto 5 nm thick amorphous Si substrates, with contrast around strand backbone enhanced for publication clarity.

