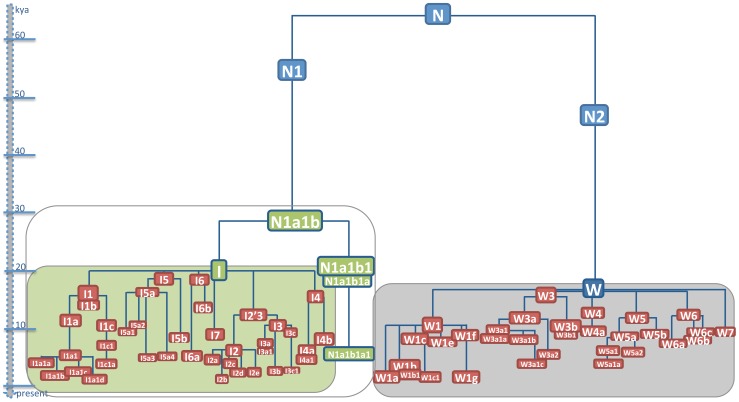
Figure 1. Phylogenetic tree of haplogroups N1a1b and W.
This schematic representation is based on 196 N1a1b and 223 W mitogenomes whose phylogenetic relationships are illustrated in detail in Figure S1 and Figure S2. The phylogenetic connections between N1a1b and W are also shown. Approximate ages can be inferred from the scale. For haplogroups N1a1b and W, they correspond to the ML ages in Table 1 while previously reported ML ages were employed for nodes N, N1 and N2 [3].

