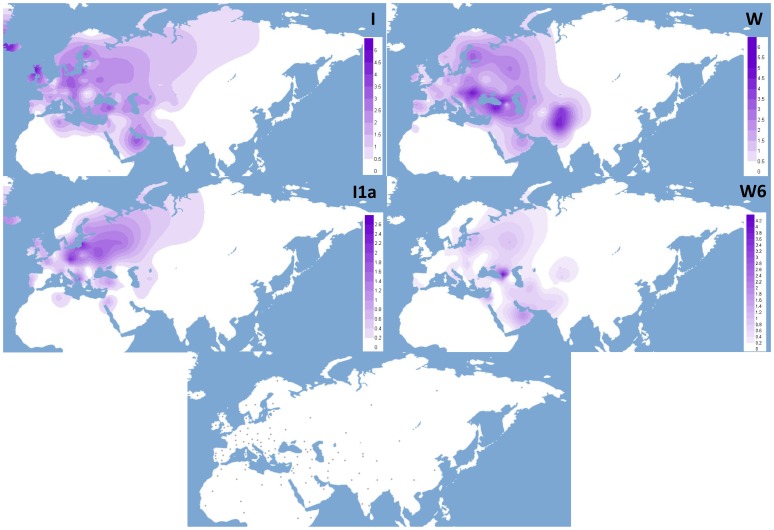
Figure 2. Spatial frequency distribution of haplogroups I and W and the sub-clades I1a and W6.
Note that different frequency scales (%) were used in the maps. The dots in the lower map indicate the geographic location of the population samples included in the survey (Table S3 in File S1).

