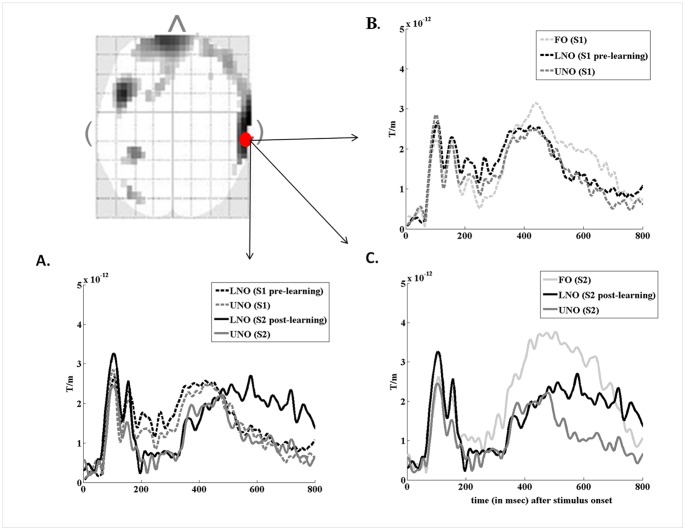
Figure 2. Learning-related changes in evoked-related fields (ERFs) over the right temporal region (analysis in sensor space).
Two dimensional statistical map (left, top side) showing sensor-space differences (t-test, p<.001) in field intensities of LNO evoked-responses between sessions (LNO S1< S2), at 740 msec post-stimulus onset masked by the repetition effect for UNO objects (S1 vs. S2). Red points indicate the location of MEG gradiometers (26 33 and 26 32) eliciting evoked responses represented on Figure 2 (a, b and c). (a) Grand average time courses of ERFs for LNO and UNO non-objects at S1 (LNO: black hyphenated line, UNO: gray hyphenated line) and S2 (LNO: black line; UNO: gray line). Significant differences are identified 720–740 msec post-stimulus onset. (b) Grand average time course of ERFs for FO (light gray hyphenated line), pre-learning LNO (black hyphenated line) and UNO (gray hyphenated line) at S1. (c) Grand average time course of ERFs for FO (light gray line), pre-learning LNO (black line) and UNO (gray line) at S2.

