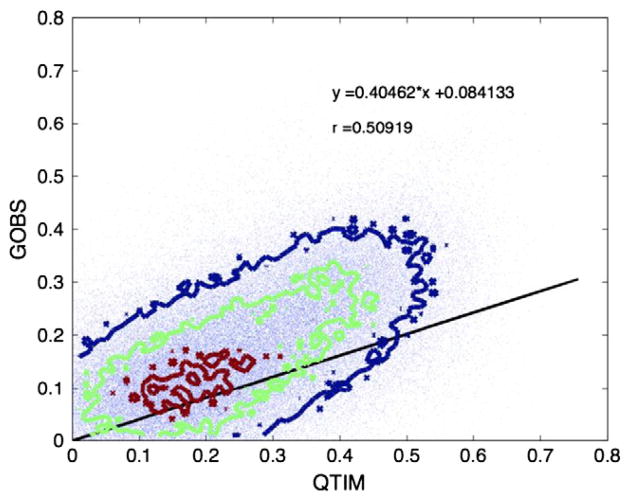
Fig. 5.
Heritability of the GOBS sample and the QTIM sample are moderately correlated (r = 0.51) at a voxelwise level. Contour plots show the densities of distribution. The heritability of all the voxels along the skeleton is plotted against each other for each cohort. The solid line reflects the best fitting linear relation between the x and y coordinates, as denoted by the equation.

