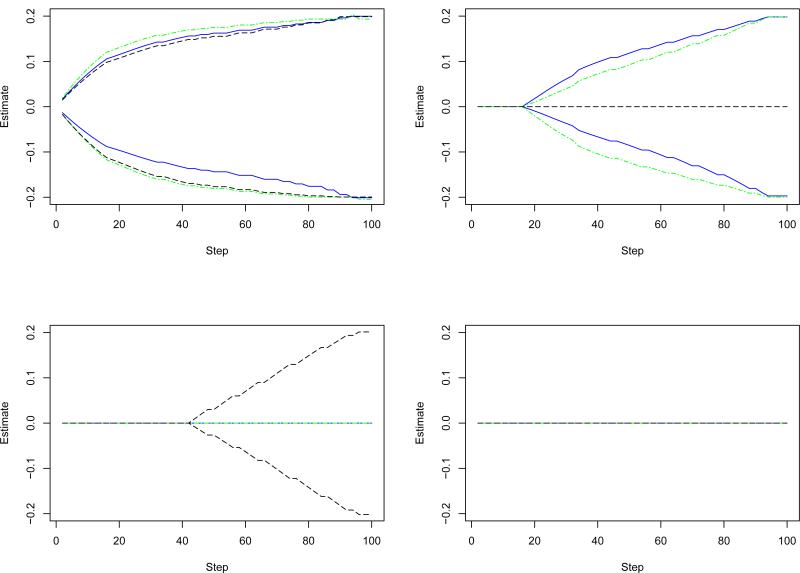
Figure 1.
Parameter path for a simulated dataset. Left-upper panel: a gene associated with three subtypes; Right-upper panel: a gene associated with two subtypes; Left-lower panel: a gene associated with one subtype; Right-lower panel: a gene not associated any subtype. Each gene has two SNPs. Different types of lines represent different genes.

