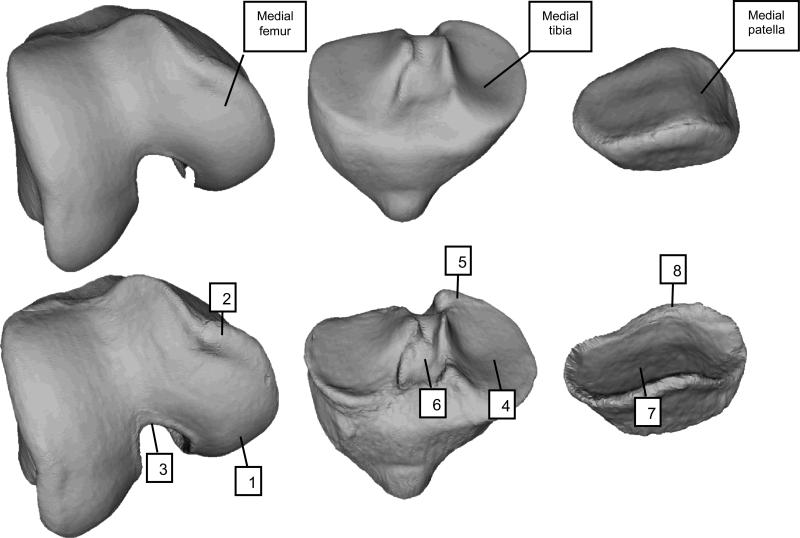
Figure 2.
Three-dimensional visualization of OA and control shapes (Labeled as “B” and “A”, respectively, in Figure 1). Top row depicts control shape for femur, tibia, and patella; bottom row depicts OA shape for those same bones. With OA, the femur shape changes include a widening and flattening of the condyles (1), increased ridge of osteophytic growth around the cartilage plate (2), and narrowing of the notch (3). Tibia shape changes include a widening and flattening of the condyles (4), increased ridge of osteophytic growth around the cartilage plate (5), and tibial spines moving closer together (6). The patella has similar patterns of increased size of the cartilage plate (7) and osteophytic ridge (8).

