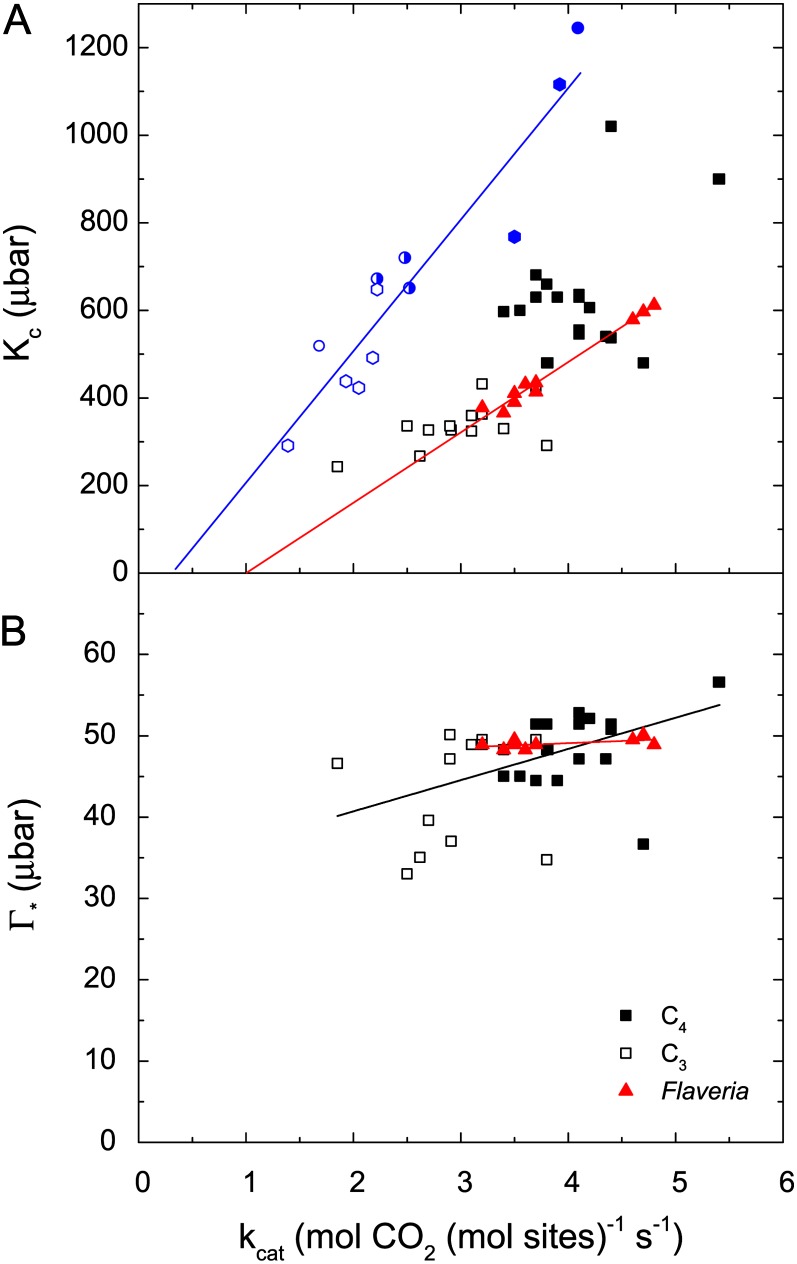
Figure 3.
Comparison of Rubisco kinetic parameters from different species and transgenic constructs to examine whether parameters can vary independently. A, Kc versus kcat (25°C except for data from Ishikawa et al. [2009, 2011] shown in blue measured at 28°C). Due to the variability in assay results between studies, separate regressions are shown for subsets of species measured in blue (Kc = −97 + 303 kcat [r2 = 0.87]; Ishikawa et al., 2009, 2011) and in red (Kc = −156 + 160 kcat [r2 = 0.97]; Whitney et al., 2011b). B, Γ* (which is inversely related to the specificity factor; Eq. 2) versus kcat. The regression equations are Γ* = 33 + 3.8 kcat (r2 = 0.22; black line, all data) and Γ* = 47 + 0.53 kcat (r2 = 0.23; red line, Flaveria spp. data). Hollow and solid black squares represent C3 and C4 species, respectively, combined from Parry et al. (2011) and Whitney et al. (2011a); red solid triangles are from Whitney et al. (2011b); blue hollow and solid hexagons are C3 and C4 species, respectively, from Ishikawa et al. (2009); and blue circles are from Ishikawa et al. (2011) as follows: hollow circle, rice; solid circle, sorghum; half-solid circle, chimeric Rubisco with rice large subunits and sorghum small subunits.

