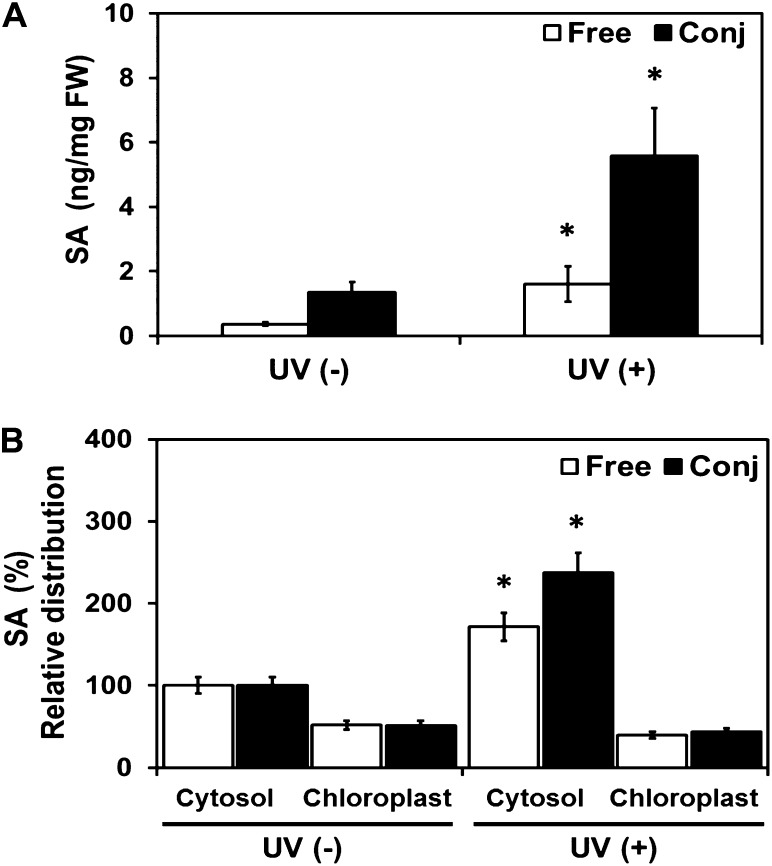
Figure 1.
Distribution of free and conjugated SA in leaves of Arabidopsis after stimulation of SA biosynthesis by UV exposure. Three-week-old Arabidopsis plants were exposed to UV, and SA was subsequently determined. A, Free and conjugated SA content in whole leaves. B, SA relative distribution to non-UV-induced plants in the cytosol and chloroplasts. Representative results of three independent experiments each with three replicates are shown. Significant differences (Student’s t test; P < 0.05) of means ± sd from noninduced wild-type plants are indicated by asterisks. FW, Fresh weight.

