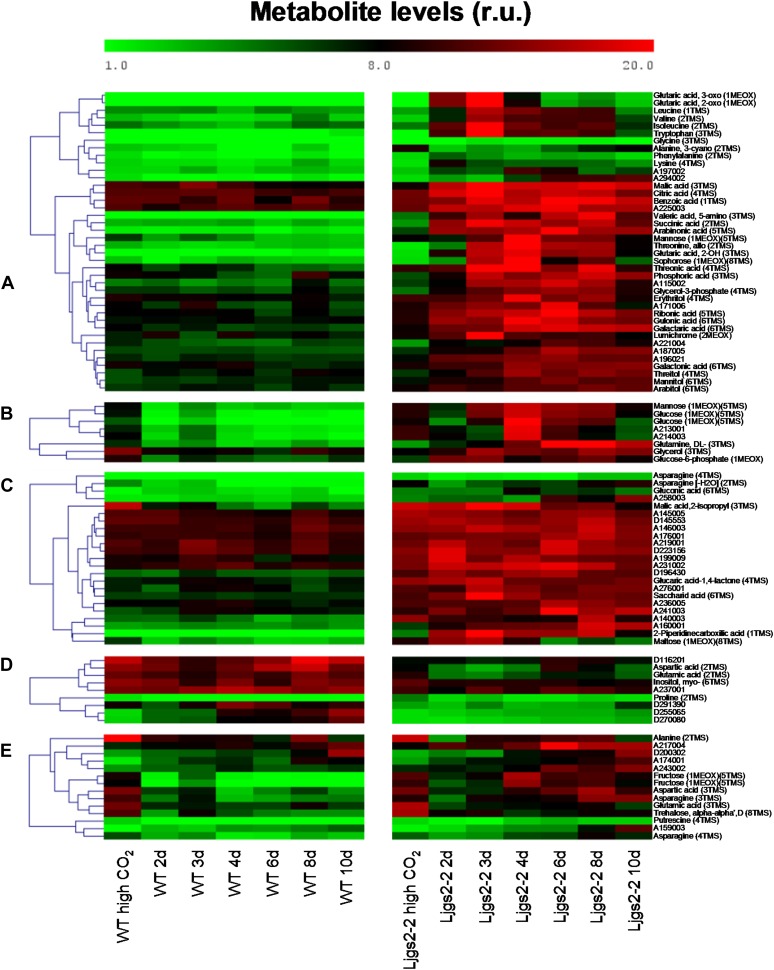
Figure 6.
Metabolite profiling of wild-type and Ljgln2-2 mutant plants. The metabolomic profiles of wild-type and Ljgln2-2 mutant plants were statistically analyzed using a supervised two-factorial ANOVA, with “genotype” and “time of exposure to normal CO2” (0, 2, 3, 4, 6, 8, and 10 d after transfer from high to normal CO2 atmosphere) as factors at a stringent threshold (P < 0.0001). Five different groups were defined by clustering tools. Data represent the direct normalized responses of metabolite pool measures. The color bar represents this relative unit (r.u.). More details can be found in “Materials and Methods.”

