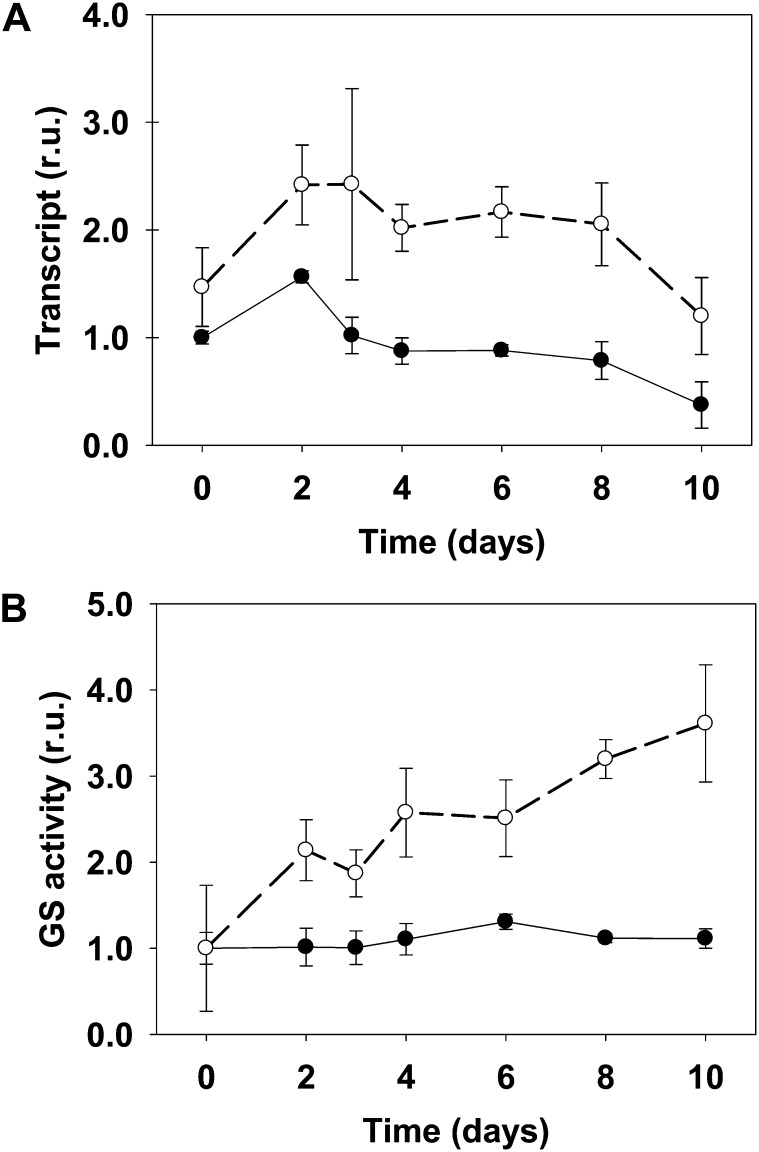
Figure 7.
LjGln1.2 cytosolic GS transcript levels (A) and total GS activity (B) in wild-type and Ljgln2-2 mutant plants. A, The relative expression levels of the LjGln1.2 gene encoding for a cytosolic GS isoform were determined by quantitative RT-PCR in leaves of the wild type (black dots, black line) and Ljgln2-2 (white dots, dashed line). Plants were grown under high CO2 for 35 d and transferred for the indicated periods of time to normal CO2 atmosphere. Transcript levels are reported as relative units (r.u.). For comparative purposes, the transcript levels measured in the wild-type plants before the transfer to normal CO2 conditions (time 0) were taken as 1. B, The GS specific activity was determined in crude extracts from leaves of the wild type (black dots, black line) and Ljgln2-2 (white dots, dashed line) at the same time points as in A. Total GS activity is reported as relative units (r.u.). For comparative purposes, the specific GS activity at time zero in wild-type or in mutant leaves was taken as 1 for the wild type and mutant, respectively. Total GS activity at time zero was 591 and 85 milli-Units mg–1 protein in wild-type and mutant leaves, respectively. Data are the mean ± sd of three independent biological replicates.

