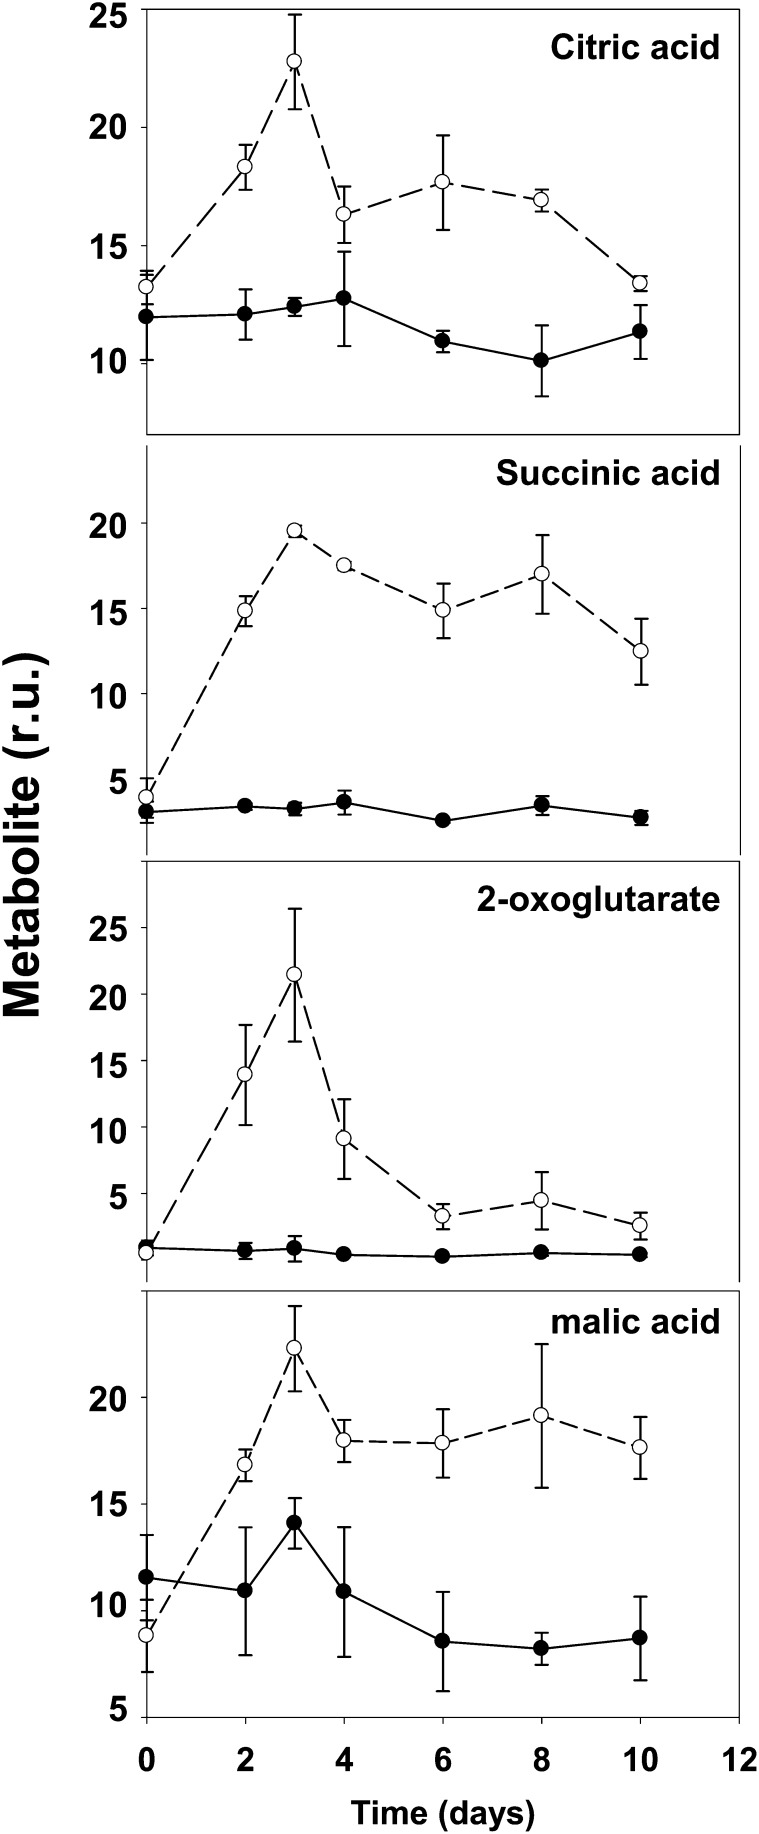
Figure 8.
Time course of some organic acids in wild-type and mutant plants. The relative amount of some organic acids that were defined as significantly different between the wild type and mutant by the statistical analysis of Figure 6 is reported at different times after the transfer of the plants to normal CO2 conditions. Black dots and black line indicate the wild type and white dots and dashed line indicate Ljgln2-2 mutant. Metabolite levels are reported as relative units (r.u.).

