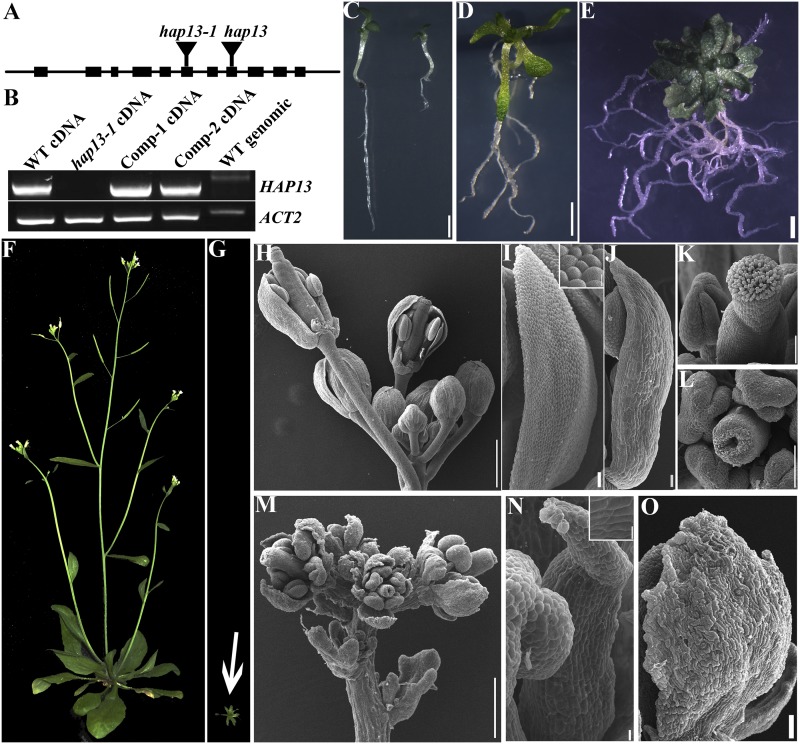
Figure 2.
Characterization of hap13-1. A and B, Schematic illustration of HAP13 genomic organization and transcript analysis of the insertional mutants. “Comp” indicates the HAP13-GFP;hap13-1 plants. WT, Wild type. C, Wild-type (left) and hap13-1 (right) seedlings at 7 DAG. D and E, A hap13-1 plant on MS medium at 20 DAG (D) or 30 DAG (E). F and G, Wild type (F) and hap13-1 (G) plants grown in soil at 40 DAG. The image shown in G was taken at the same scale as that shown in F. H to K, Inflorescence (H), petal (I), sepal (J), and pistil (K) of the wild type. Sepals and petals are partially removed from two flowers in H to show the inner whorls. The inset in I shows epidermal cells of a wild-type petal. L to O, A representative pistil (L), inflorescence (M), petal (N), and sepal (O) of hap13-1. The inset in N shows epidermal cells of a hap13-1 petal. Bars = 2 mm for C to E, 500 µm for H and M, 5 µm for H and M insets, 50 µm for I, J, N, and O, and 100 µm for K and L.

