Figure 4.
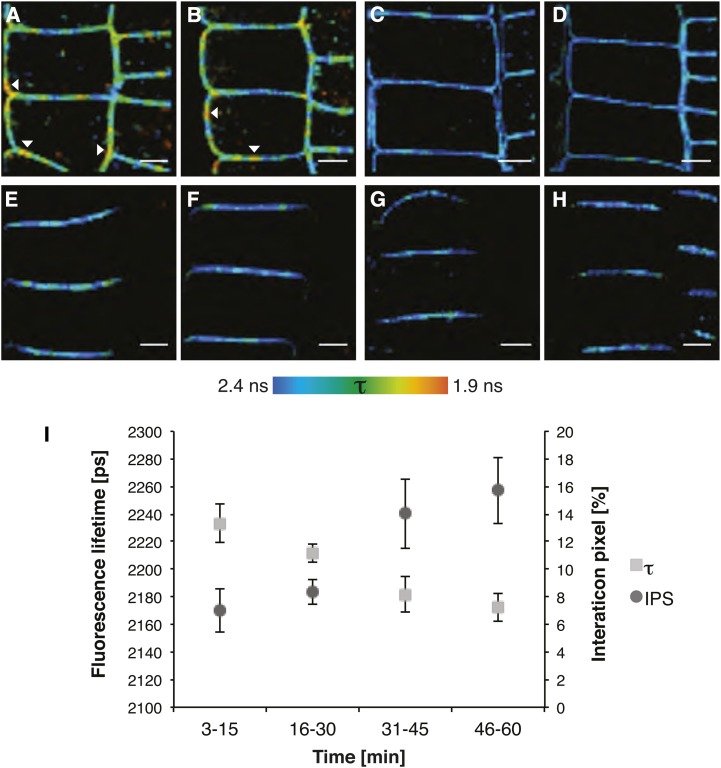
BRI1 and SERK3 interact independently of ligand. A, Fluorescence lifetime image of BRI1-GFP in the presence of SERK3-mCherry after BRZ treatment and BL stimulation (1 µm, 1 h). B, Fluorescence lifetime image of BRI1-GFP in the presence of SERK3-mCherry after BRZ treatment. C, Fluorescence lifetime image of BRI1-GFP after BRZ treatment and BL stimulation (1 µm, 1 h). D, Fluorescence lifetime image of BRI1-GFP after BRZ treatment. E, Fluorescence lifetime image of PIN2-GFP in the presence of SERK3-mCherry after BRZ treatment and BL stimulation (1 µm, 1 h). F, Fluorescence lifetime image of PIN2-GFP in the presence of SERK3-mCherry after BRZ treatment. G, Fluorescence lifetime image of PIN2-GFP after BRZ treatment and BL stimulation (1 µm, 1 h). H, Fluorescence lifetime image of PIN2-GFP after BRZ treatment. I, BRI1-GFP and SERK3-mCherry associate in a time-dependent manner after BL stimulation (1 µm). FRET-FLIM results from roots of 5-d-old Arabidopsis seedlings expressing BRI1-GFP2 or coexpressing BRI1-GFP 2 and SERK3-mCherry, grown for 2 d in medium containing 5 µm BRZ, are shown. For time-course measurements, roots were embedded in BL-containing medium, and consecutive FLIM measurements were performed within a time frame of 1 h. PIN2-GFP in combination with SERK3-mCherry served as a negative control. The BRI1-GFP2/SERK3-HA line used in A to D and I is heterozygous for BRI1-GFP and homozygous for SERK3-mCherry proteins (for numerical analysis, see Supplemental Note S2). BL was used throughout the experiments. The color bar represents the false color code for BRI1-GFP fluorescence lifetimes (τ). Arrowheads indicate areas with BRI1-GFP fluorescence lifetimes below 2 ns. Bars = 5 µm.

