Figure 5.
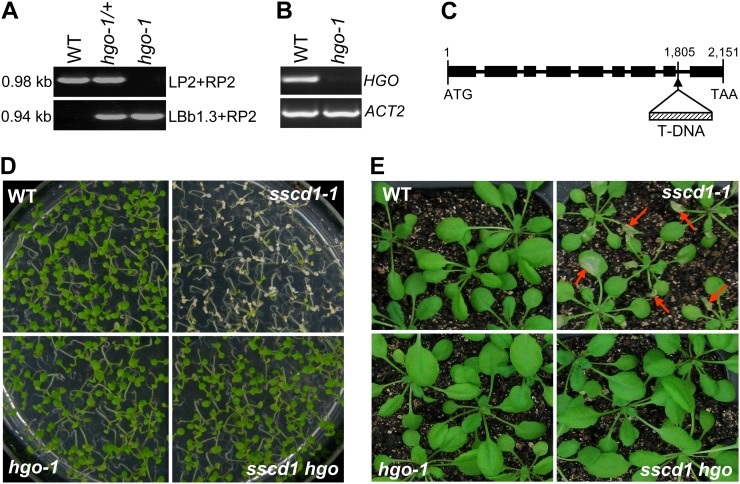
The hgo-1 mutant completely suppresses the cell death phenotype of the sscd1-1 mutant. A, PCR-amplified products from the wild type (WT), heterozygote (hgo-1/+), and homozygote (hgo-1) using two specific primer pairs, LP2 + RP2 and LBb1.3 + RP2 (see “Materials and Methods”). The sizes of the PCR products are indicated. B, RT-PCR analysis of HGO expression in the wild type and the hgo-1 mutant. C, Structure of the HGO gene (from the translation start codon to the stop codon) and the location of the T-DNA insertion in the hgo-1 mutant. Black boxes and thick lines represent exons and introns, respectively. The numbers indicate the locations of bases relative to the start codon (ATG). TAA is the stop codon. D, Wild-type, sscd1-1, hgo-1, and sscd1 hgo seedlings grown on MS under SD for 9 d. E, Wild-type, sscd1-1, hgo-1, and sscd1 hgo seedlings grown in soil under LD for 2 weeks and then under SD for 6 d. The red arrows indicate some of the wilted leaves.

