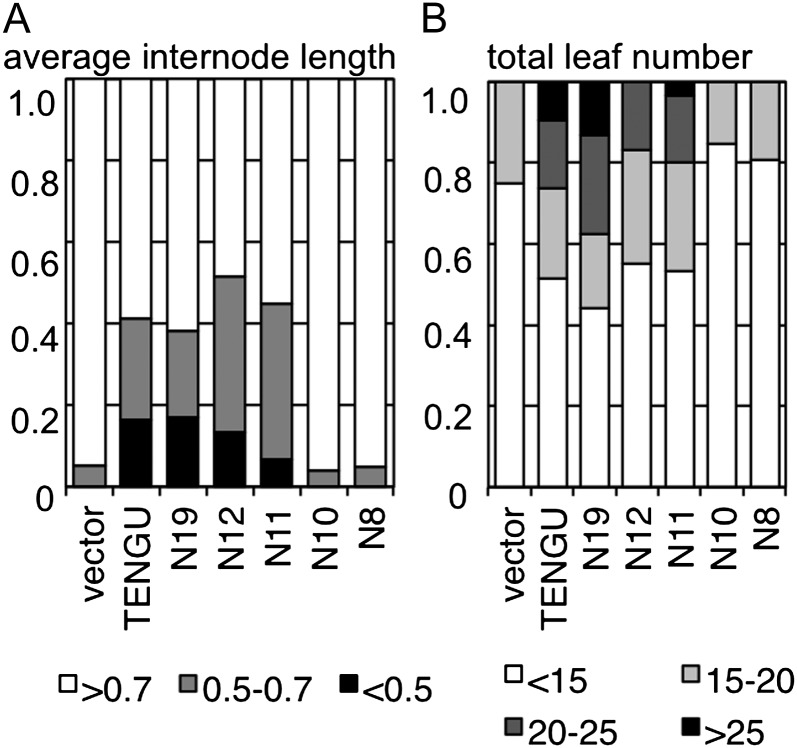
Figure 2.
Quantification of symptom-inducing activity of TENGU truncation mutants. A, Stacked bar graph showing the proportion of plants with an average internode length of less than 0.5 cm (black boxes), 0.5 to 0.7 cm (gray boxes), or more than 0.7 cm (white boxes). B, Stacked bar graph showing the proportion of plants with a total leaf number of more than 25 (black boxes), 20 to 25 (dark gray boxes), 15 to 20 (light gray boxes), and less than 15 (white boxes). The total number of plants is shown in Table I.

